Tariff News
Review of Southern California Edison's New Post Solar Electricity Rates and its Impact on Savings
By John Tucker
| Reading time 5 minutes
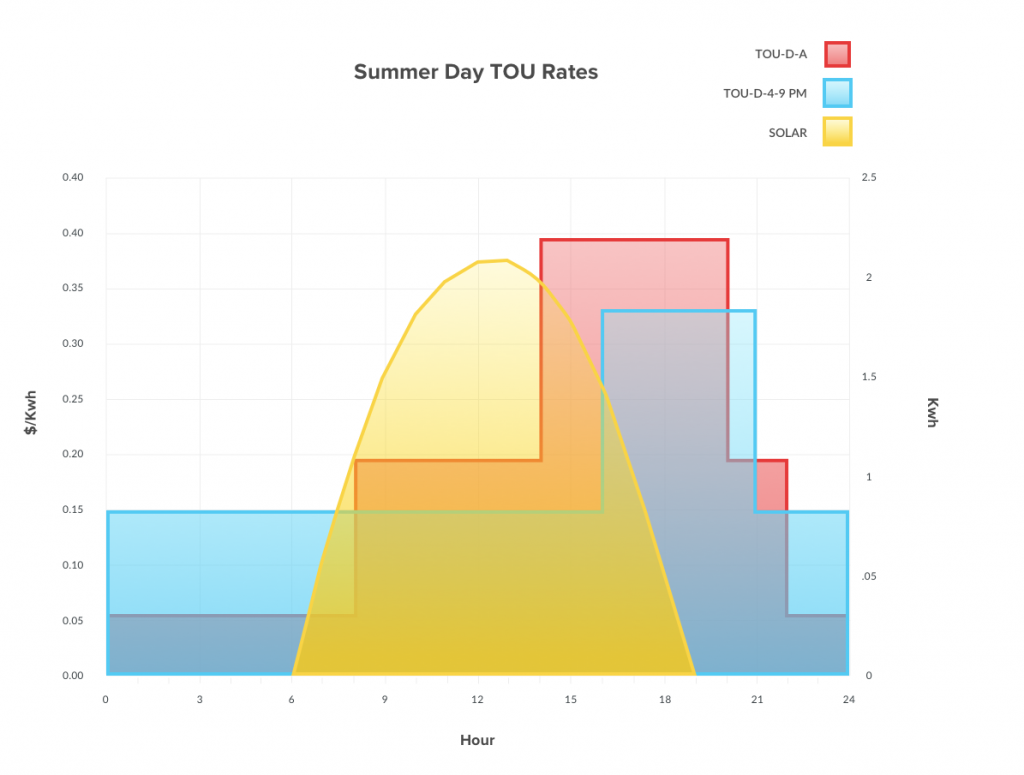
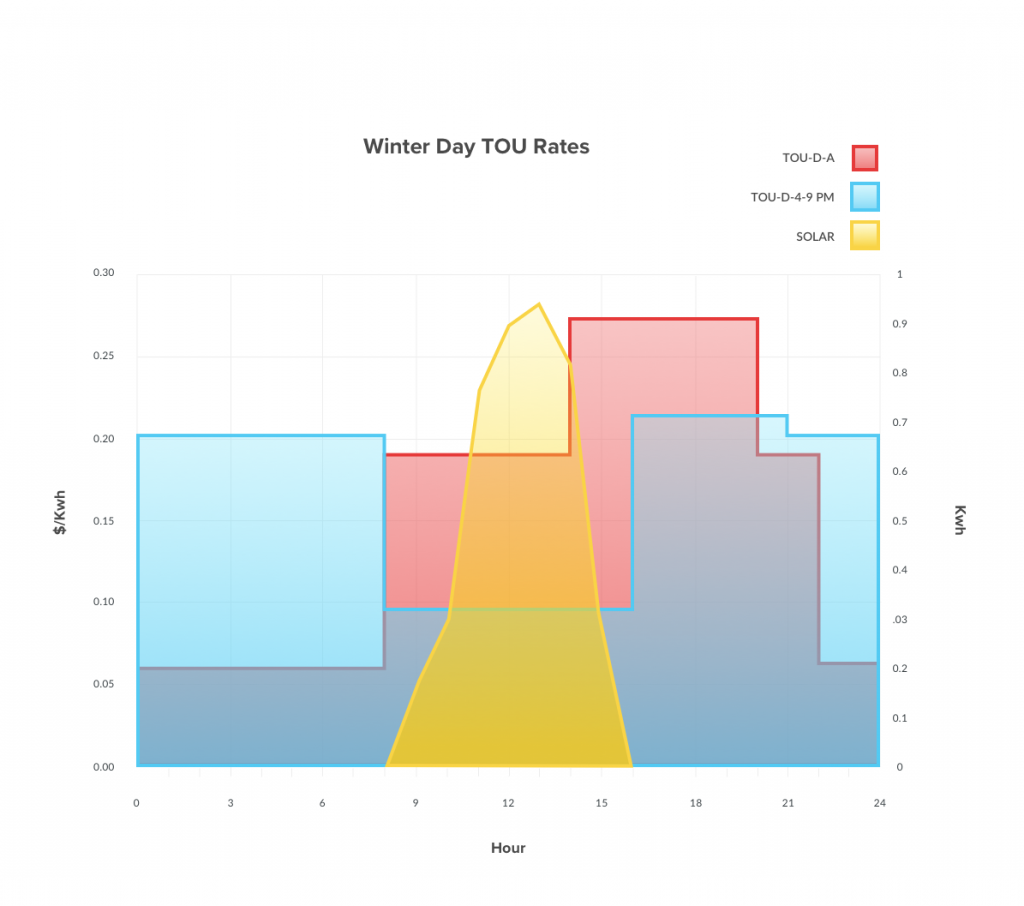
On March 1, 2019 Southern California Edison (SCE) will close its current default post-solar tariff (TOU-D-A-NEM2) and replace it with a new default post-solar tariff (TOU-D-4-9PM-NEM2). This tariff change will dramatically impact solar savings in SCE as the Time of Use (TOU) On-Peak hours move from 2-8 PM under TOU-D-A-NEM2 to 4-9 PM under TOU-D-4-9PM-NEM2. More importantly TOU-D-4-9PM-NEM2 introduces a Super Off-Peak period in the Winter from 8 AM to 4 PM, when the majority of solar production occurs.
What Will Change in Genability APIs?
On March 1, 2019 Genability will:
- Mark TOU-D-A-NEM2 as closed in our system. This should eliminate it as a choice in your post-solar tariff drop-down list.
- Flag TOU-D-4-9PM-NEM2 as the default post-solar tariff. This will default the post-solar tariff to TOU-D-4-9PM-NEM2 automatically and put it at the top of your post-solar tariff drop-down list.
How are Solar Savings Affected?
Nearly all customers will save less with TOU-D-4-9PM-NEM2 than with TOU-D-A-NEM2. We looked at the Avoided Cost of Power (ACP) for a customer that uses 10,000 kWh annually in each SCE baseline region under the old and new default solar tariffs and found ACP decreases across the board.
| Zone | TOU-D-A | TOU-D-4-9PM | Change |
|---|---|---|---|
| 5 | 20.4¢ | 14.5¢ | -29% |
| 6 | 21.5¢ | 15.6¢ | -27% |
| 8 | 21.5¢ | 15.6¢ | -27% |
| 9 | 21.0¢ | 15.2¢ | -28% |
| 10 | 20.9¢ | 14.6¢ | -30% |
| 13 | 20.7¢ | 14.7¢ | -29% |
| 14 | 20.9¢ | 14.6¢ | -30% |
| 15 | 20.0¢ | 13.5¢ | -33% |
| 16 | 21.2¢ | 15.1¢ | -29% |
Why such a big change in ACP? It all comes down to the new Time of Use periods and the difference in the price from the previous periods.
How Do the TOU Periods and Prices Differ?
In the graphs below we show a typical summer and winter weekday under the old tariff (TOU-D-A-NEM2) and the new tariff (TOU-D-4-9PM-NEM2). All rates below reflect the first tier price with the Baseline Credit included.


While the new tariff name highlights the change in the On-Peak period from 2-8 PM to 4-9 PM, the biggest impact comes from the introduction of the Super Off-Peak period in the Winter. The new Super Off-Peak period is from 8AM to 4PM every day from October 1 through May 31 and provides the lowest net metering credit when the customer is most likely to be exporting kWh to the grid.
What Happens to Non-Bypassable and Minimum Charges?
Non-Bypassable charges are identical between the old and new default post-solar tariffs, so you will see little change there. We recently published another blog post on Non-Bypassable Charges and the alternate minimum they set for California tariffs.
Minimum charge calculations are also unchanged between the old and new default post-solar tariffs. That said you are much more likely to see the impact of SCE’s Delivery Minimums under the new TOU-D-4-9PM-NEM2.
SCE calculates minimum charges against the Delivery Charges only and adds the Generation Charges on top of the minimum charges. This means that you can trigger the $10/month Delivery Minimum for SCE and still be responsible for considerable Generation Charges under the new TOU structure.
Here’s an example monthly post-solar calculation under both TOU-D-A-NEM2 and TOU-D-4-9PM-NEM2. The customer has significant negative usage which results in just the delivery minimum under the old default tariff. But under the new default tariff the customer’s bill is nearly quadrupled due to the positive Generation Charges.

Which Systems Generate the Best Avoided Cost of Power (ACP)?
We were curious where the best savings are to be found in SCE under the new tariff, so we ran a few scenarios in every SCE Baseline Region. We varied both the Solar Offset (80%, 90%, 100%) and the size of the customer’s load (Lo = 10,000 kWh per year, Hi = 20,000 kWh per year). Here’s what we found:
| Zone | 80% Lo | 90% Lo | 100% Lo | 80% Hi | 90% Hi | 100% Hi |
|---|---|---|---|---|---|---|
| 5 | 14.9¢ | 14.5¢ | 14.2¢ | 16.5¢ | 16.1¢ | 15.7¢ |
| 6 | 16.1¢ | 15.6¢ | 15.2¢ | 23.3¢ | 22.3¢ | 21.5¢ |
| 8 | 16.1¢ | 15.6¢ | 15.2¢ | 23.3¢ | 22.3¢ | 21.5¢ |
| 9 | 15.6¢ | 15.2¢ | 14.8¢ | 19.9¢ | 19.2¢ | 18.6¢ |
| 10 | 15.0¢ | 14.6¢ | 14.2¢ | 18.1¢ | 17.6¢ | 17.1¢ |
| 13 | 15.0¢ | 14.7¢ | 14.2¢ | 17.6¢ | 17.1¢ | 16.7¢ |
| 14 | 15.1¢ | 14.6¢ | 14.3¢ | 18.4¢ | 17.9¢ | 17.4¢ |
| 15 | 13.8¢ | 13.5¢ | 13.3¢ | 19.5¢ | 18.8¢ | 18.2¢ |
| 16 | 15.5¢ | 15.1¢ | 14.8¢ | 20.3¢ | 19.7¢ | 19.1¢ |
The results highlight three factors that increase savings:
- Smaller offsets increase ACP - Lower offset mean less exports. Since exports are valued less than import due to NBCs, smaller offset yield higher ACPs.
- Larger loads increase ACP - SCE offers a Baseline Credit for all usage up to a certain level (the exact level varies by the season, region and number of days in the billing period). With large loads, a smaller percentage of the customer’s load receives the baseline credit of 6.7¢.
- Regions with low Baseline Allocations see higher savings - Savings are highest in Zones 6 and 8 because the baseline allocations are lowest there. That means more high-priced power offset by solar.
Alternative Post-Solar Tariffs for SCE
TOU-D-4-9PM-NEM2 is not the only choice available to new customer’s with solar. They can also opt for TOU-D-5-8-NEM2 or the new TOU-D-PRIME-NEM2 (called the TOU-D-C in previous rate filings).
TOU-D-5-8-NEM2 offers a short On-Peak period but a higher differential between On-Peak and Off-Peak prices. This rate is likely best used in concert with a storage system that can bank excess generation during the day for release during the shorter On-Peak period. With solar only, we see that the TOU-D-5-8-NEM2 offers decreased savings of roughly 0.3¢/kWh across all offsets and load sizes, as compared to TOU-D-4-9PM-NEM2.
TOU-D-PRIME-NEM2 has the same Time of Use structure as the 4-9 PM tariff, but does not have the Baseline Credit. This rate structure is ideal for large power users who will happily pay more for the power that would otherwise receive the baseline credit in exchange for a lower rate applied to high usage amounts. In our analysis we saw that TOU-D-C-NEM2 started to reach ACP parity with TOU-D-4-9PM-NEM2 when the load reached 15,000 kWh per year and we saw up to 0.5¢/kWh increase in ACP when the load reached 20,000 kWh annually.
Final Thoughts
While it’s disappointing to see the economics of rooftop solar become more challenging, the new rates reflect the impact that rooftop solar has had on California’s generation mix. California’s electric grid is flooded with solar-generation in the Spring and the new low generation rates from October through May reflect the plentiful solar power available during that period
Genability is here to help you navigate these new rates. Our number one recommendation is for you to start running calculations against the new rates immediately and use Dash and Explorer to help you understand how the new rates behave. There will be a path forward for solar in SCE, even as the duck (curve) comes home to roost.
Also in Tariff News
Review of California's Proposed Commercial Time of Use Electricity Tariffs
By John Tucker | Dec 20, 2018
Solar Incentives in Illinois, Net Metering Ends for Duke Energy South Carolina
By John Tucker | Jul 31, 2018
Solar Incentives in Massachusetts
By John Tucker | Jul 11, 2018
Duke Energy North Carolina Solar Incentives
By John Tucker | Jul 9, 2018

